
1% per trade
- Worst drawdown
- −7.7%
- Gain to recover
- +8.4%
- Trades played
- 60 of 60
Still in the game, within the plan
Money management first
Nobody is right on every trade. What keeps you in the game is how much you accept to lose. Rulyx calculates your exact position size from the risk you set and tells you, before every trade, whether it fits your plan: a losing trade never costs more than you planned.
15-day free trial, no card · then €6.99/month or €69.90/year
The demonstration
60 fictional trades, the same for everyone: 40% winners at RR 2, so an approach with a positive expectancy. Early on, a streak of 8 losses in a row, as every trader goes through. The trader accepts to lose at most 20% of their capital. Pick their risk per trade.
Still in the game, within the plan
Max loss reached on trade #11: plan stopped
At 5% per trade, the same losing streak uses up the whole accepted loss by trade 11. The approach did not change, nor did the trades: the trader is simply no longer there to see it play out.
At a 50% win rate, over 1,000 trades, a streak of 10 losses in a row is to be expected. It is not bad luck: it is a statistic. The only question is what it costs you.
In blue, the capital left. The figure on the right: the total loss.
A loss is always recovered with a larger gain. The deeper you fall, the steeper the climb.
−50%needs+100%
After −50%, you need +100% on what is left to get back to your starting capital.
Do the math
Social media sells RRs of 5. The win rate that comes with them is rarely mentioned. An RR alone says nothing: the RR / win-rate pair decides. And that is math.
97% of traders end up losing
18% of traders end up losing
Expectancy = RR × win rate − (1 − win rate)
An RR of 5 must win more than 17% of trades just to break even, and brings long losing streaks. An RR of 1 needs only 50%, but a steady rate. Neither is “the right one”: only your real RR / win-rate pair counts.
Simulation on fictional trades, at 1% risk per trade, to illustrate a mechanism: it predicts no result.
The Rulyx policy
You don’t control the market. You control how much you accept to lose. Even with imperfect analysis, money management you follow keeps every loss planned and capped: your capital stays protected long enough for your approach to play out. Every Rulyx screen starts from that rule: decide what you can lose before you think about what you can gain.
Example capital: $10,000. Change the settings: every link updates.
Portfolio risk
20%
The total loss you accept on this portfolio. You set it once, calmly, before the first trade.
Losing streak
14 losses
The worst run of losses to survive, derived from your win rate (40%) and the 1,000 trades you plan.
Max risk per trade
1.42%
Portfolio risk ÷ losing streak. Even the worst streak you plan for fits in the loss you accept.
Position size
28 units
Computed from your stop. Example: entry at $100, stop at $95 → 28 units. Planned loss: $140, no more (excluding slippage and gaps).
Even 14 losses in a row at 1.42% would cost only 18.1% of capital: less than the 20% you accept. The trader stays in the game.
Before every trade
You set your money management once. Then every screen enforces it, with no math to do in your head.
1Before you enter
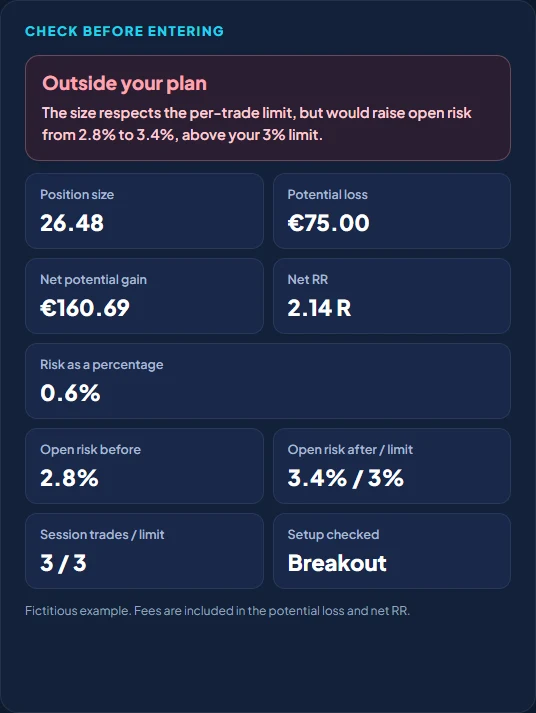
Entry, stop, target: Rulyx calculates your exact size from your risk per trade and checks every rule. Outside your plan? It shows you what to adjust before you click.
Planned loss at the stop, in $ and %
2To size it
The largest size your plan allows, split across as many entries, targets and stops as your scenario needs.
Largest size your plan allows
3After the trade
Plan versus execution: what you planned to lose, what you actually lost, and what each slip cost you.
Planned risk versus actual risk
4Over time
Over 300 observations computed on your journal: when your risk drifts, when a losing streak sets in, what your slips cost. Facts and figures, never a signal.
Your risk slips, in figures
Your Trading System
Set your framework once; Rulyx then applies it to every decision, before you enter. Here are the rules and metrics it takes into account.
33rules and metrics checked
Every rule is optional: you turn on the ones that match the way you trade.
Your Rulyx, your way
Scalping, day trading, swing or long-term investing; solo, mentor or student: keep what you use and hide the rest. Rulyx fits every trader.
Your menu
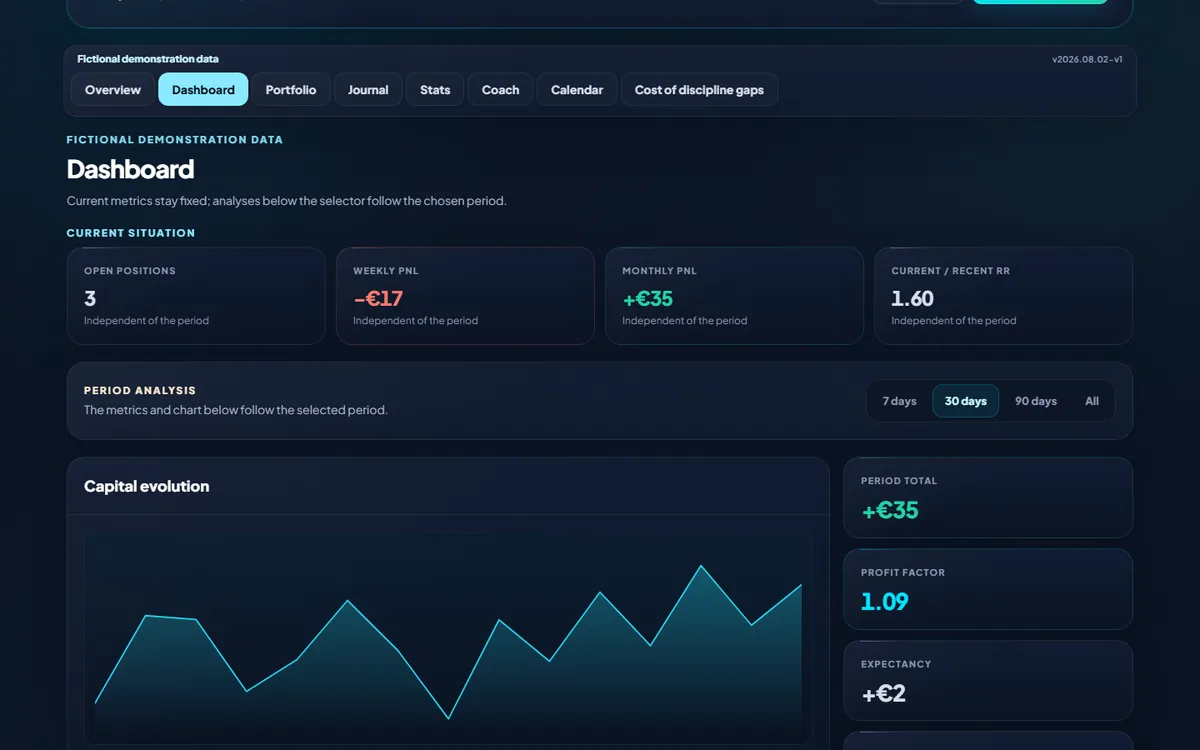
Your dashboard
Tap a widget to add or remove it. In the app, press and hold to move it.
Add, remove and move your widgets. Create up to 8 dashboards (daily check, monthly review…), duplicate and rename them, and switch in one click.
In settings, hide the tabs you don’t use: your menu only shows your tools.
Normal for your own plan, Mentor to coach students, Student to share with your mentor. The menu follows your mode.
Scalping, intraday or swing in your Trading System, plus an Investments space for the long term, if you want it.
Crypto, forex, indices, metals, stocks and futures, in your portfolio’s currency.
Install Rulyx as an app on your phone or computer, in dark or light theme, in English or French.
Interface illustration. Your choices are saved to your account and follow you on every device.
The verdict updates live: your rules one by one (✓ or ✕), and at least 3 adjustments to tick to get back within your frame. Targets in R, ATR stop, trade chart with draggable lines.
Not at your price yet? “I wait for my entry price”: Rulyx keeps your plan, alerts you when the price arrives, and you confirm “I took the trade” in one click.
The largest size your plan allows, with as many entries, targets and stops as your scenario needs.
The price of each open position, what it has made or cost since entry, and how far it is from your stop or target.
Your positions with the nearest stop or target, your trader profile scored out of 100, and news on your markets, filtered by region and theme.
Tick several portfolios, even in different currencies: Rulyx converts into the currency you choose. P&L, profit factor, calendar, latest trades.
Over 300 observations computed on your trades: what costs you, what works, what changes. A Tiltmeter measures your recent deviations. Facts and figures, never a signal.
For each rule: your results when you follow it and when you break it. And what the trades you turned down would have given.
Your results by session, day and hour, holding time, setup and asset: you finally see where you win and where you lose.
Import your MetaTrader, cTrader, Tradovate, NinjaTrader, Interactive Brokers or CSV history. Faulty rows are fixed in place, duplicates are explained.
Each trade candle by candle: your R at every moment, the best and worst point, the alert level and targets reached.
Your history recomputed: fixed risk on every trade, full exit at TP 1, wider stop. To see what would have changed, with figures.
Your plan B, written before you enter: if price reaches it, your target becomes your entry price. Rulyx flags it on your open positions.
Your Watchlist tells you by e-mail or notification when the price reaches your zone, on desktop and phone.
Ten guided scenarios to see money management in action, then your own simulations on your Trading System.
Mentor mode · students
Educators, coaches, trading communities: your student shares what they choose with you, read-only. You see which rules they follow and which they break, you comment, you suggest actions. They stay in control of their data.
Your Mentor space · Student A
Illustration with fictional data. Sharing is optional and managed from the Mentoring space.
A preset (Discipline, Risk, Performance) or item by item, the period, the portfolios and the Trading Systems involved. They can revoke it all at any time.
You paste it into “Followed traders”: their profile shows up, with only what they allowed.
Comments, questions, feedback on their trades and reviews, suggested rules, setups or actions: the student accepts or declines. Your private notes stay visible to you only.
Four steps, in this order. Start in simulation, with no money at risk.
Capital, currency, real or simulation.
Portfolio risk, losing streak, minimum RR: Rulyx derives your risk per trade.
Entry, stop, target and alert level: the exact size and a verdict before you enter.
Journal, statistics and Coach observations on your latest executions.
€6.99per month
€69.90per year · 2 months free
Final price, VAT not applicable. Cancel anytime.
15-day free trial, no card · then €6.99/month or €69.90/year
Trading involves a risk of capital loss. Rulyx gives no investment advice. The simulations on this page are educational: they use fictional trades and predict no result.